SaaS Dashboard Solutions
Designing clarity into complex enterprise data systems.
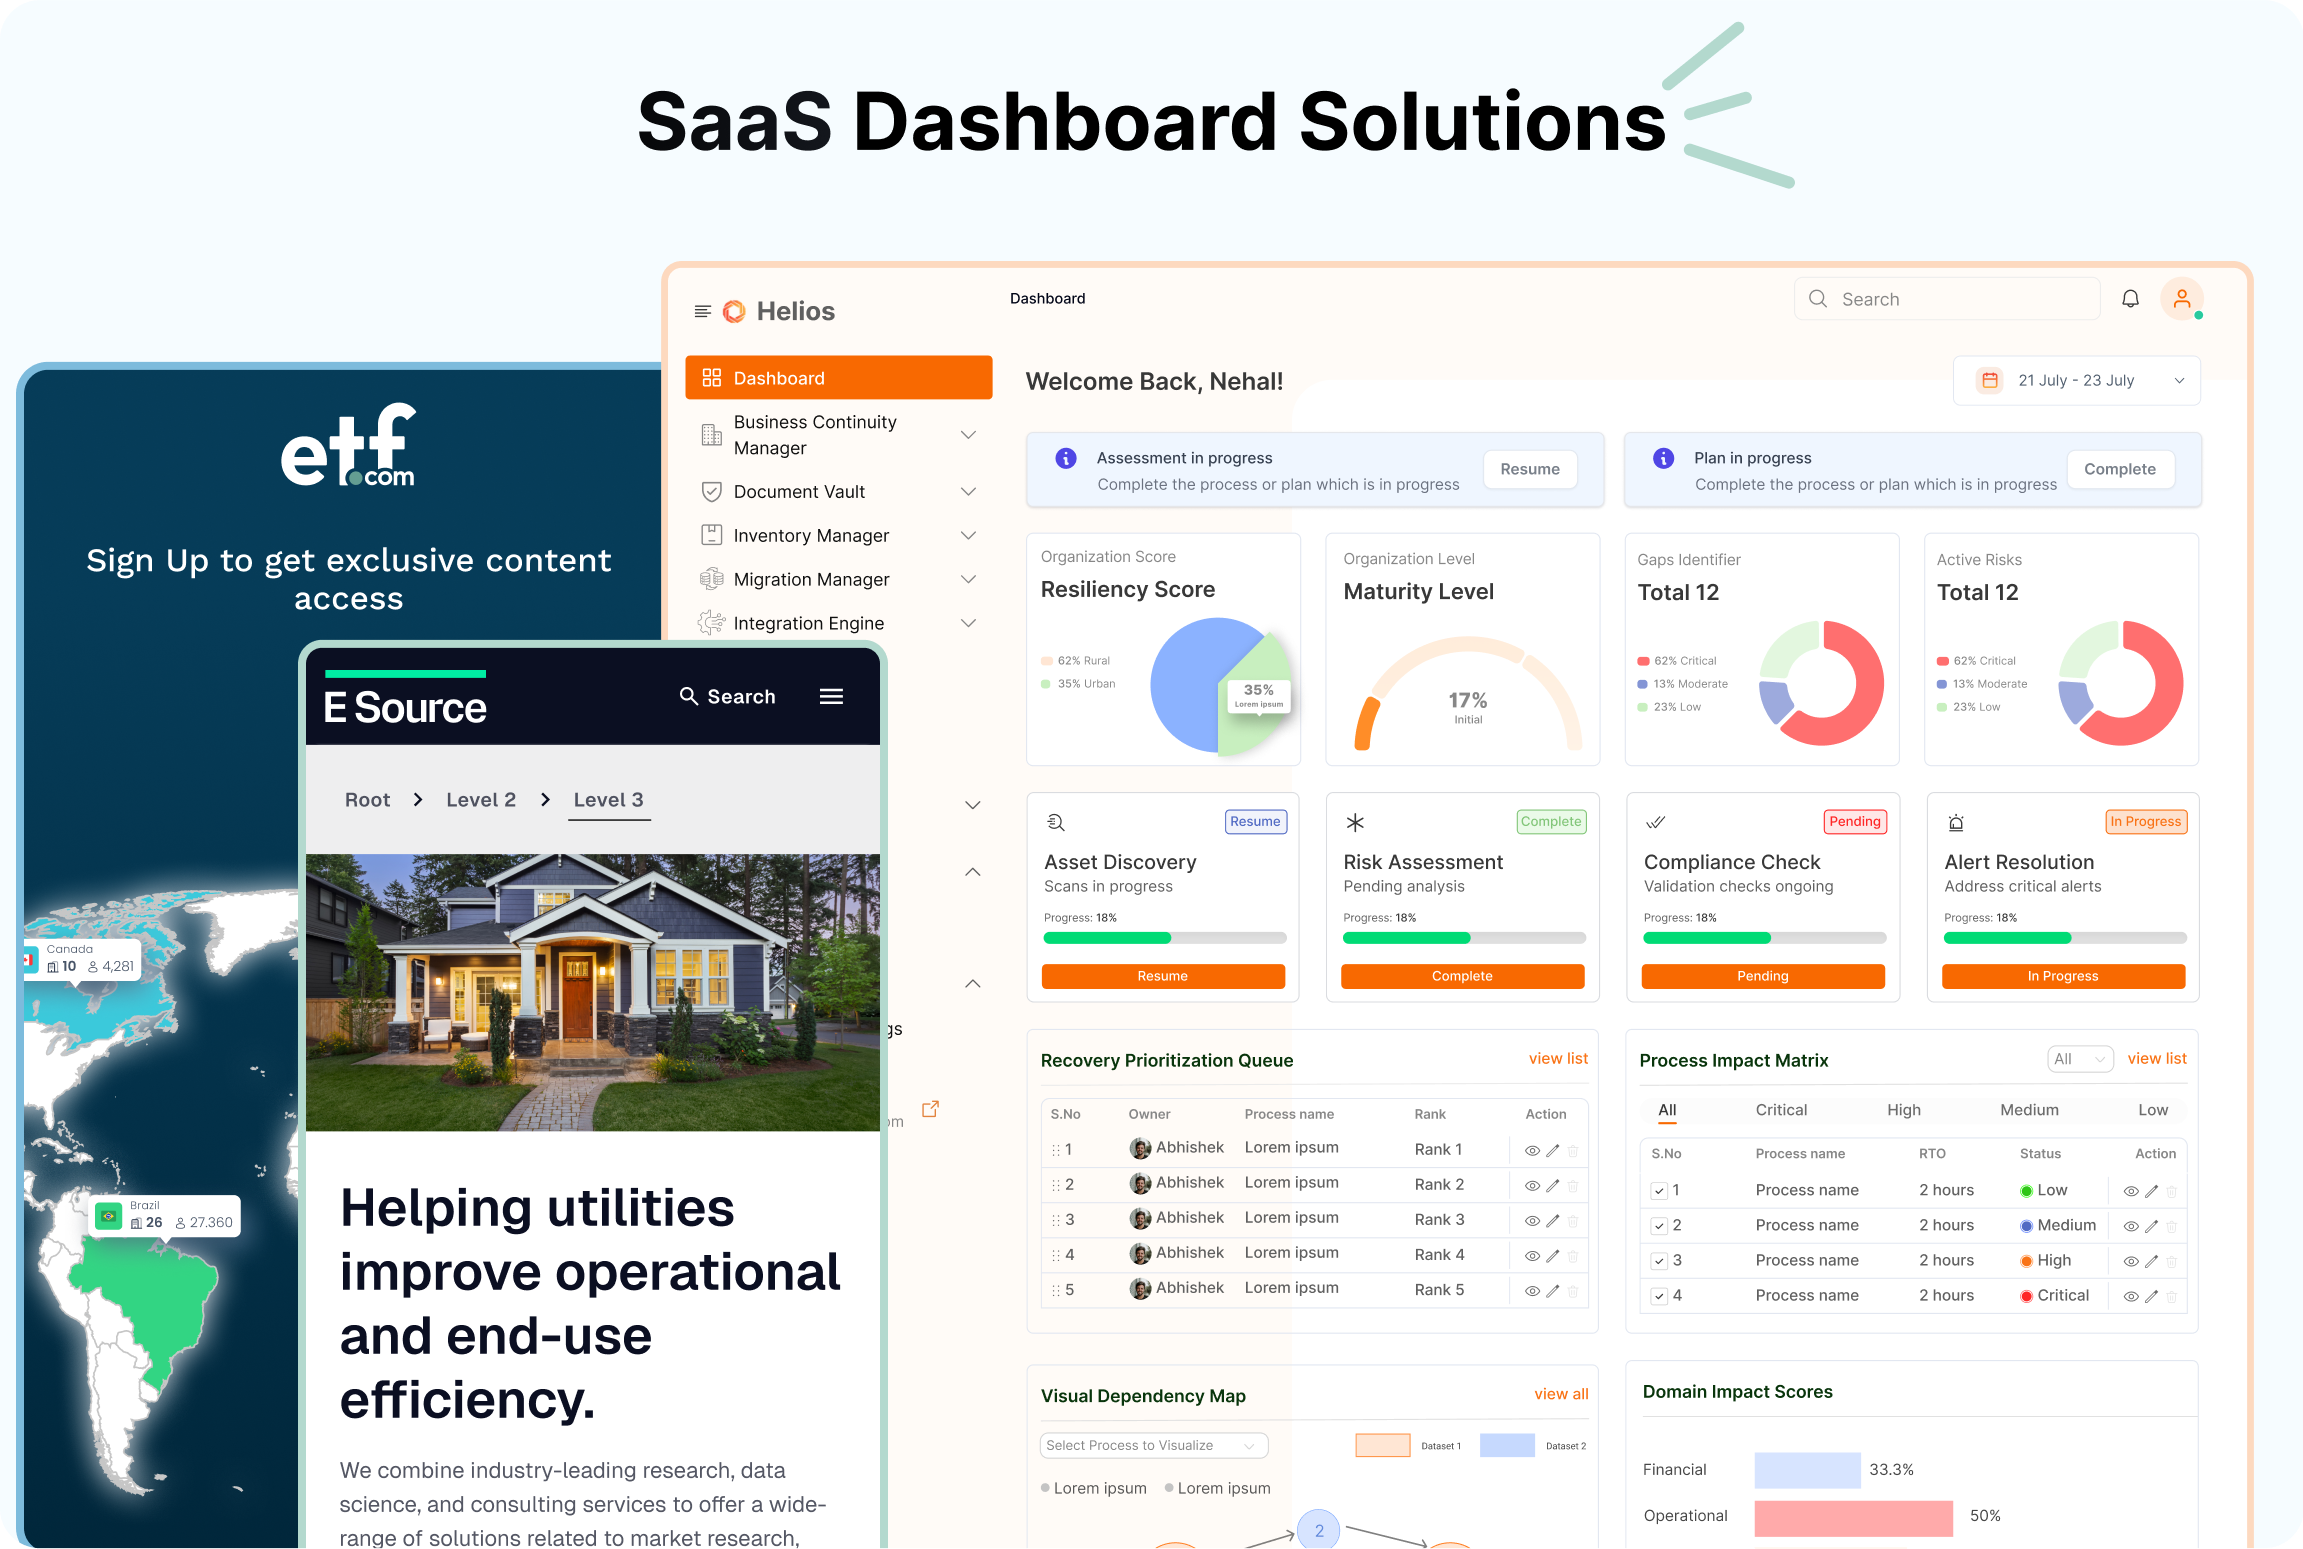
HeliosOne

Making business operational insights simpler for utility professionals.
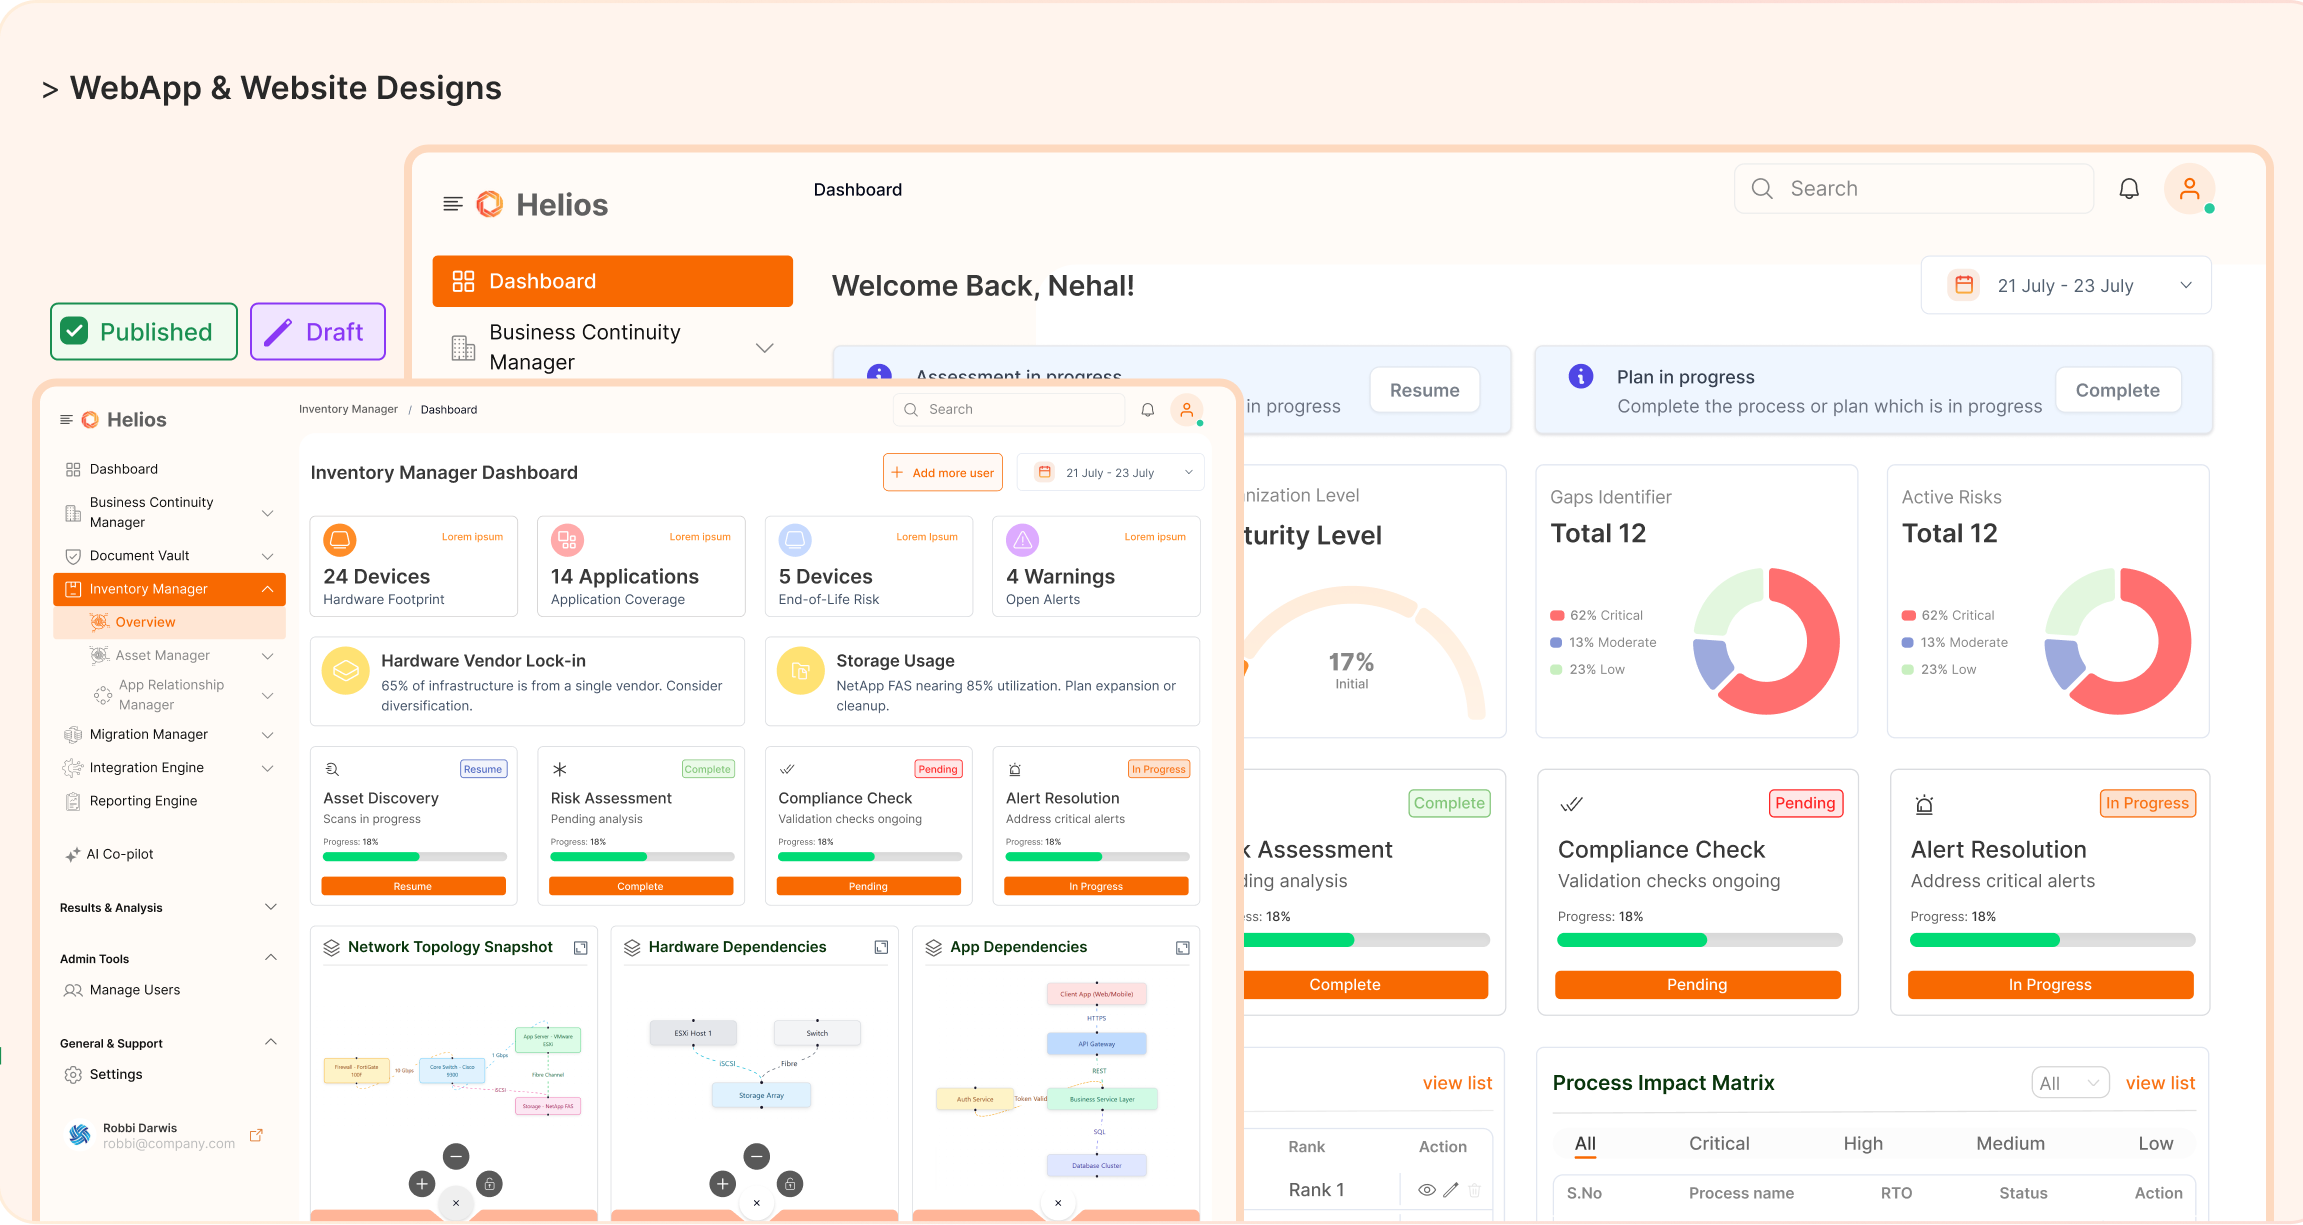
> Designed an AI-powered SaaS dashboard enabling organizations to track performance, compliance, and energy savings.
> Created a multi-panel layout with smart visualizations and real-time updates.
> Focused on color-coded KPIs and modular cards for executive decision-making.
> Integrated alert prioritization for faster issue resolution.
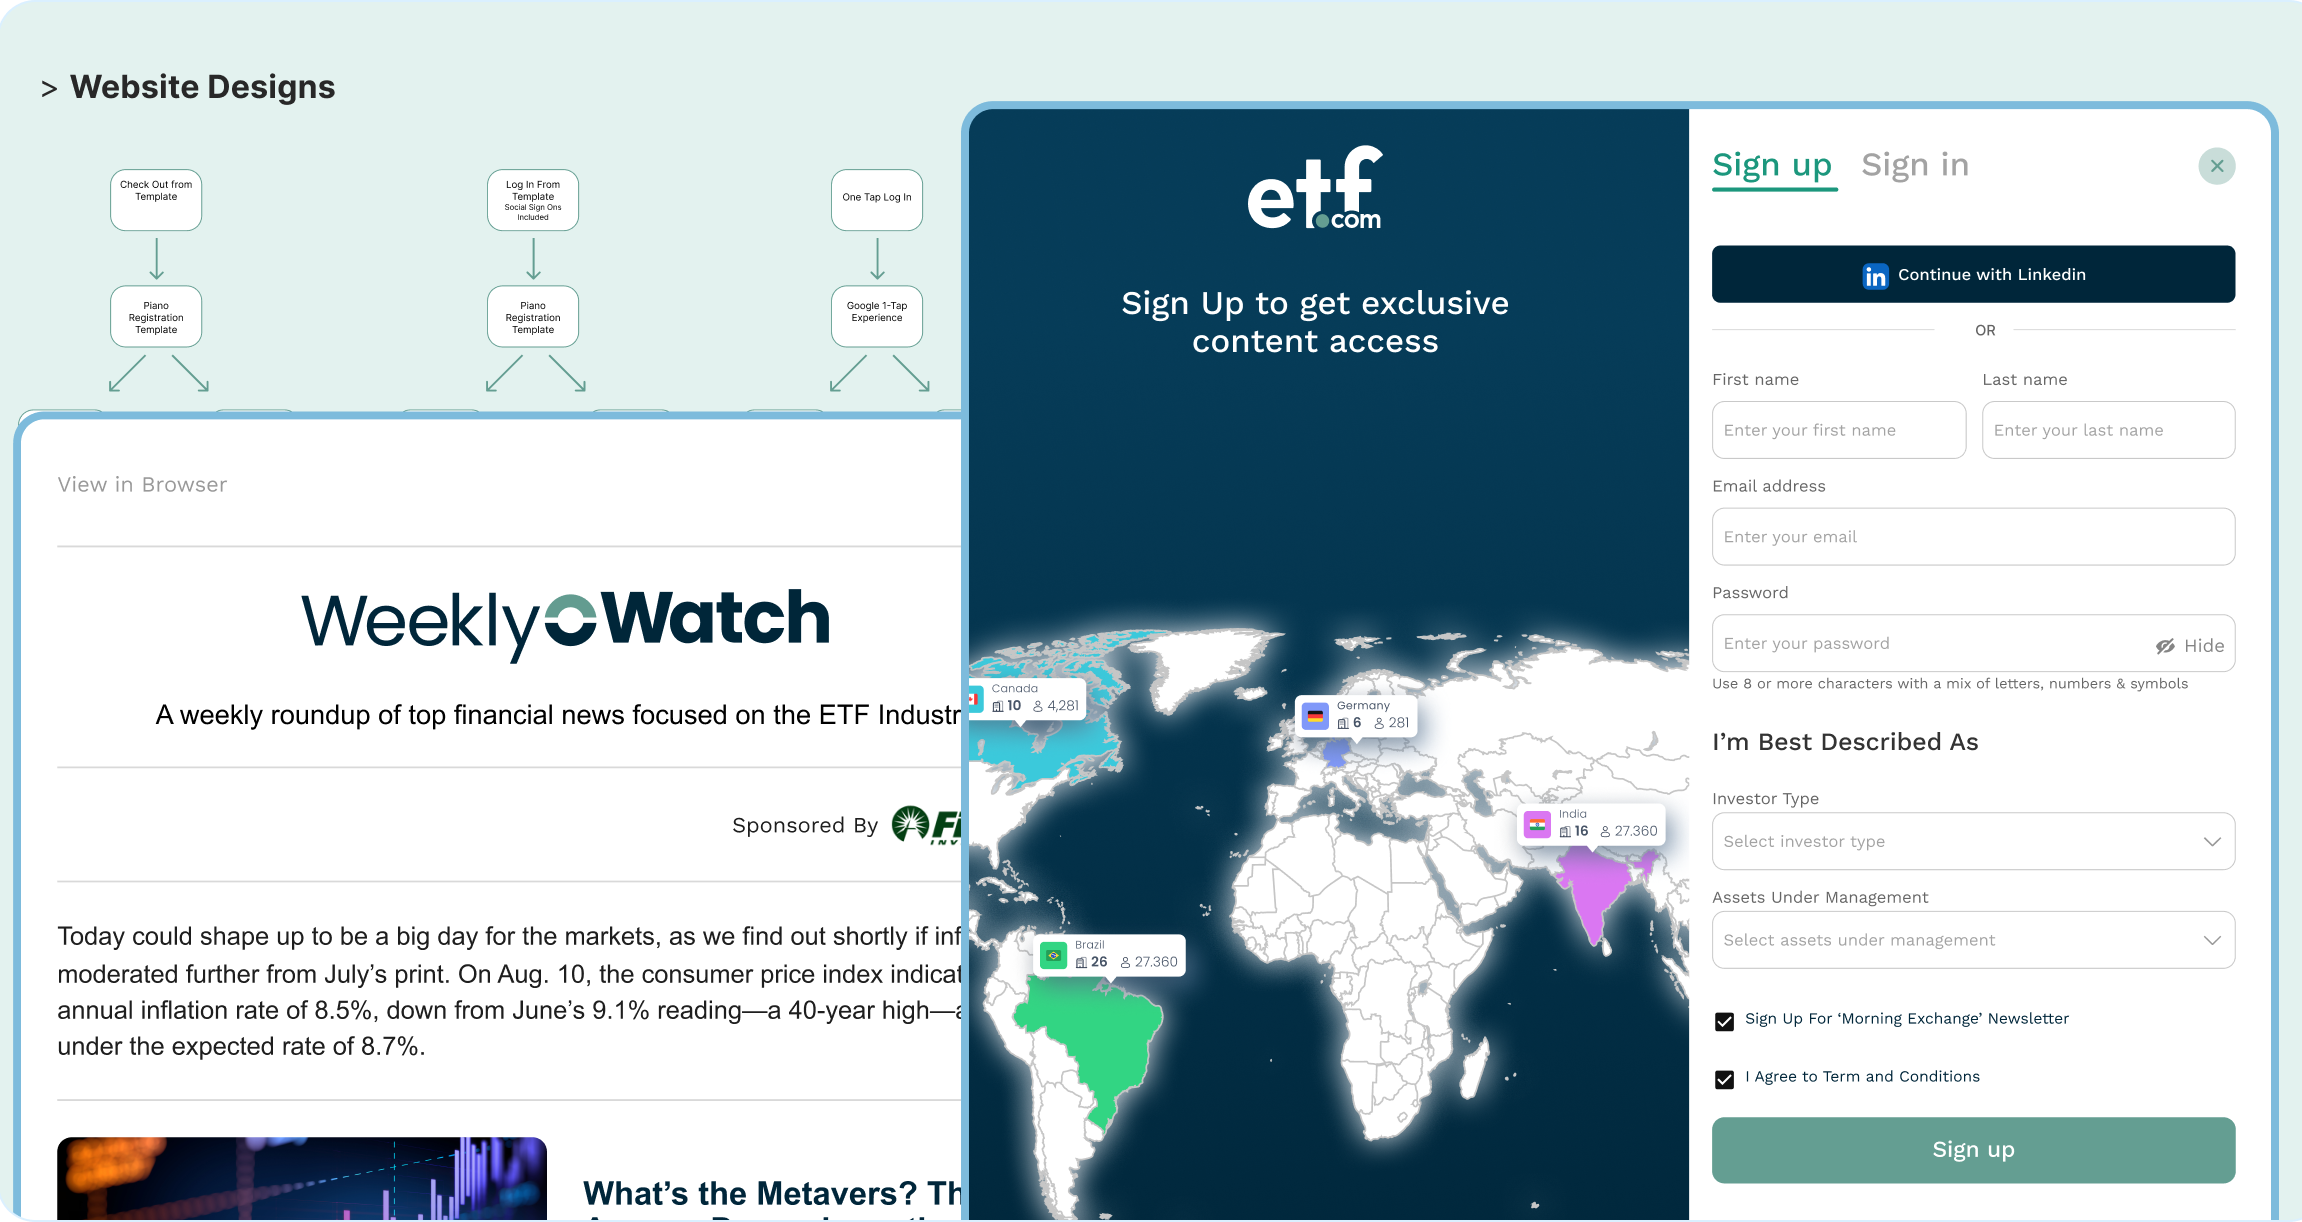
Etf.com

Bringing structure and design consistency to financial intelligence.
> Designed a dashboard experience for ETF performance tracking and content publishing.
> Simplified access to real-time fund data, trend charts, and weekly insights.
> Ensured accessibility and legibility across tablet and desktop interfaces.
> Built for scalability allowing future AI summarization modules.
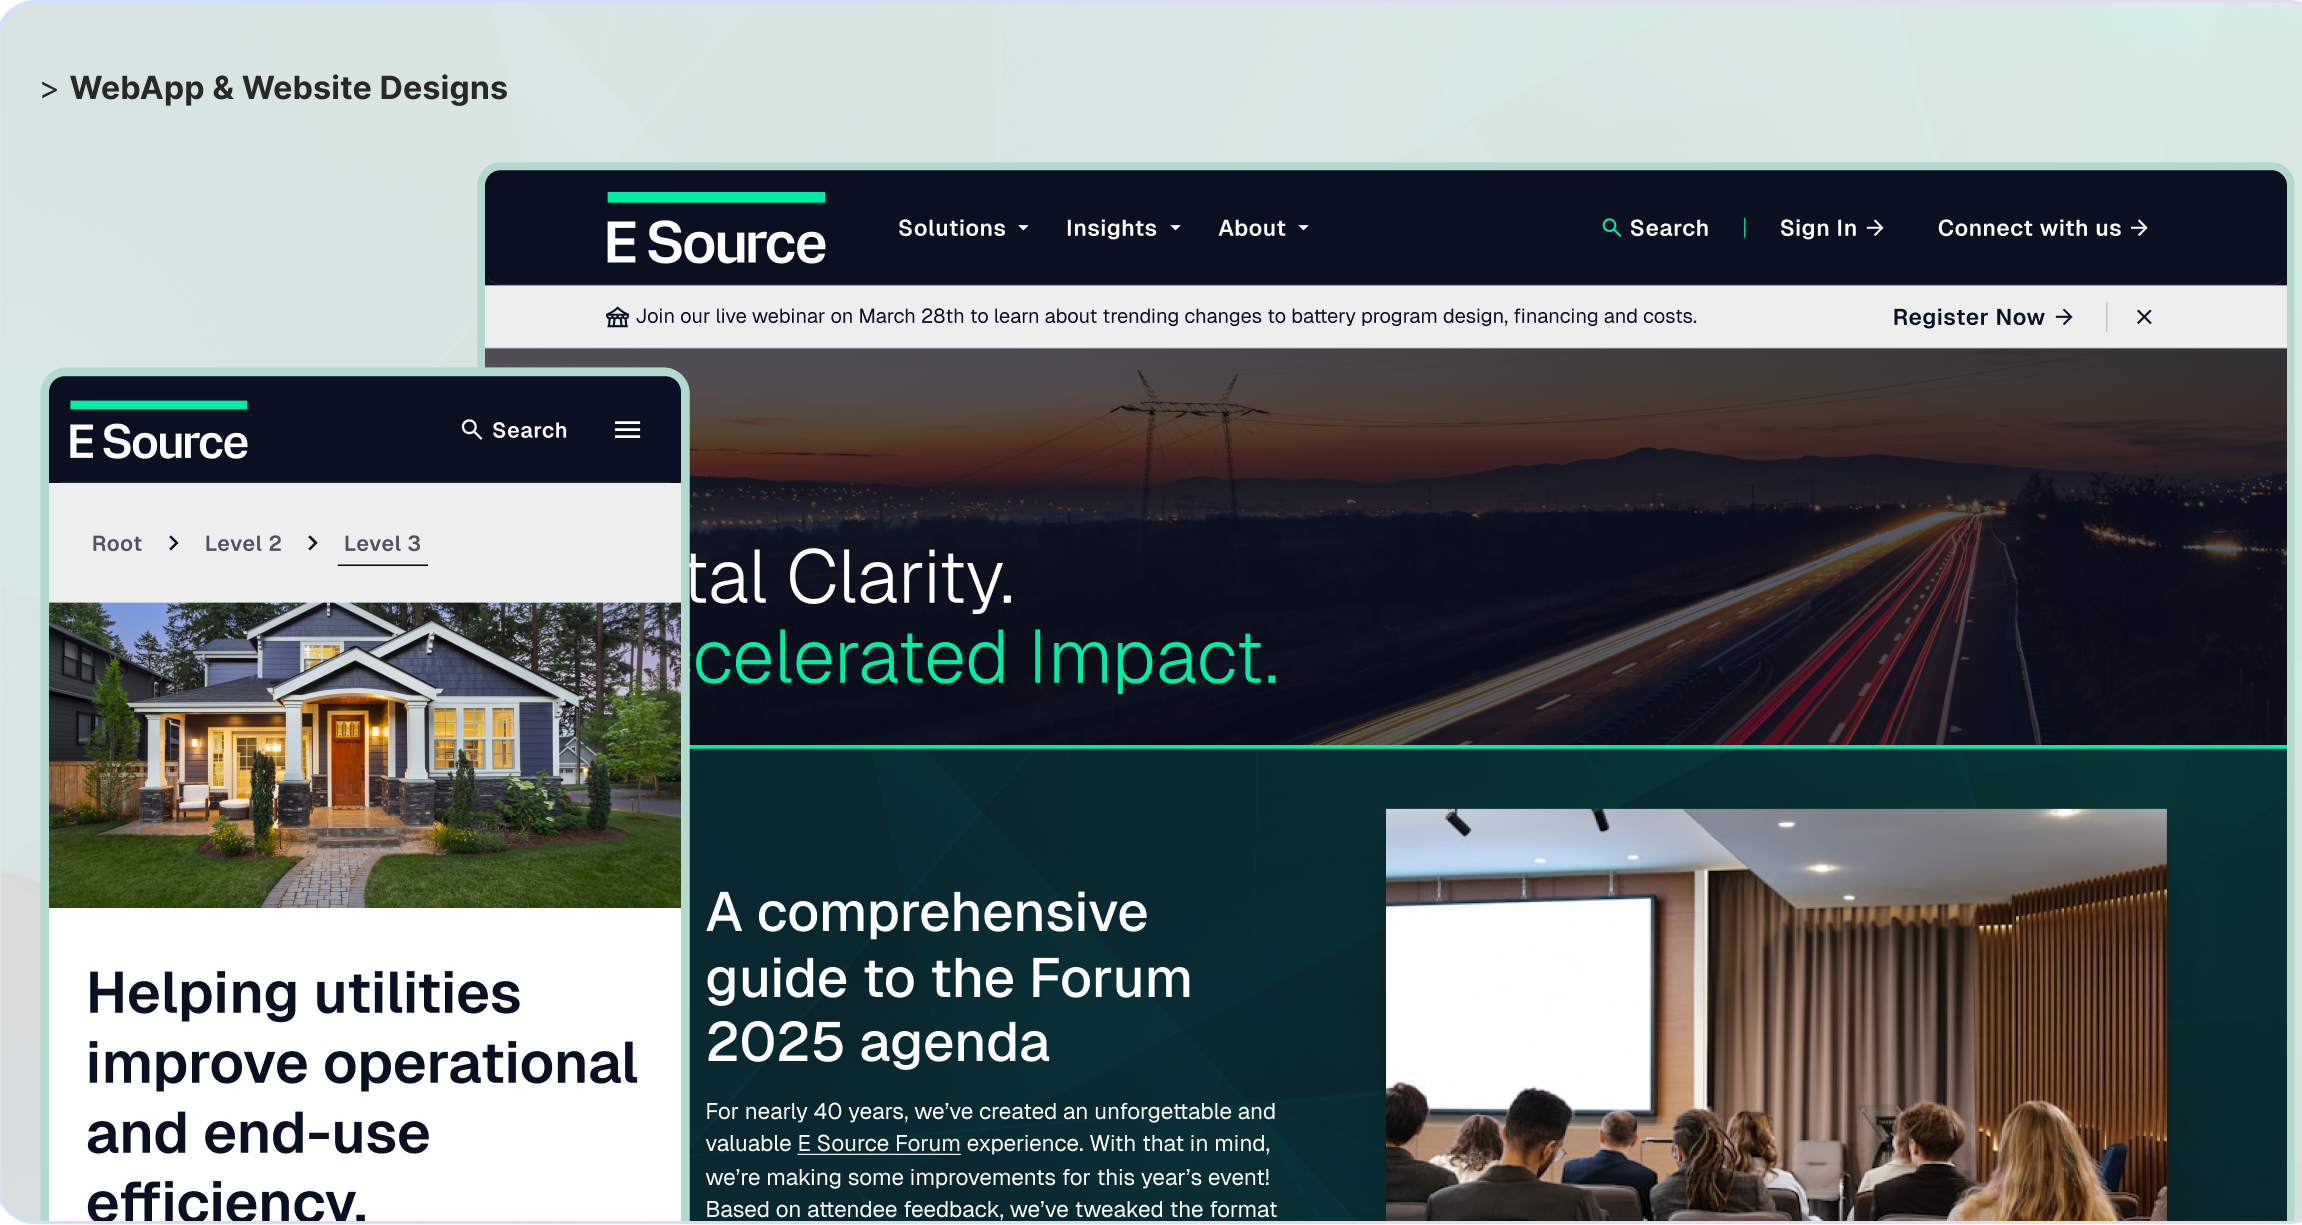
Esource
Turning dense analytics into actionable clarity..
> Redesigned the corporate analytics and resources portal.
> Implemented a content-first layout improving readability and engagement.
> Introduced adaptive card-based navigation and simplified hierarchy.
> Collaborated on color accessibility standards for better inclusivity.
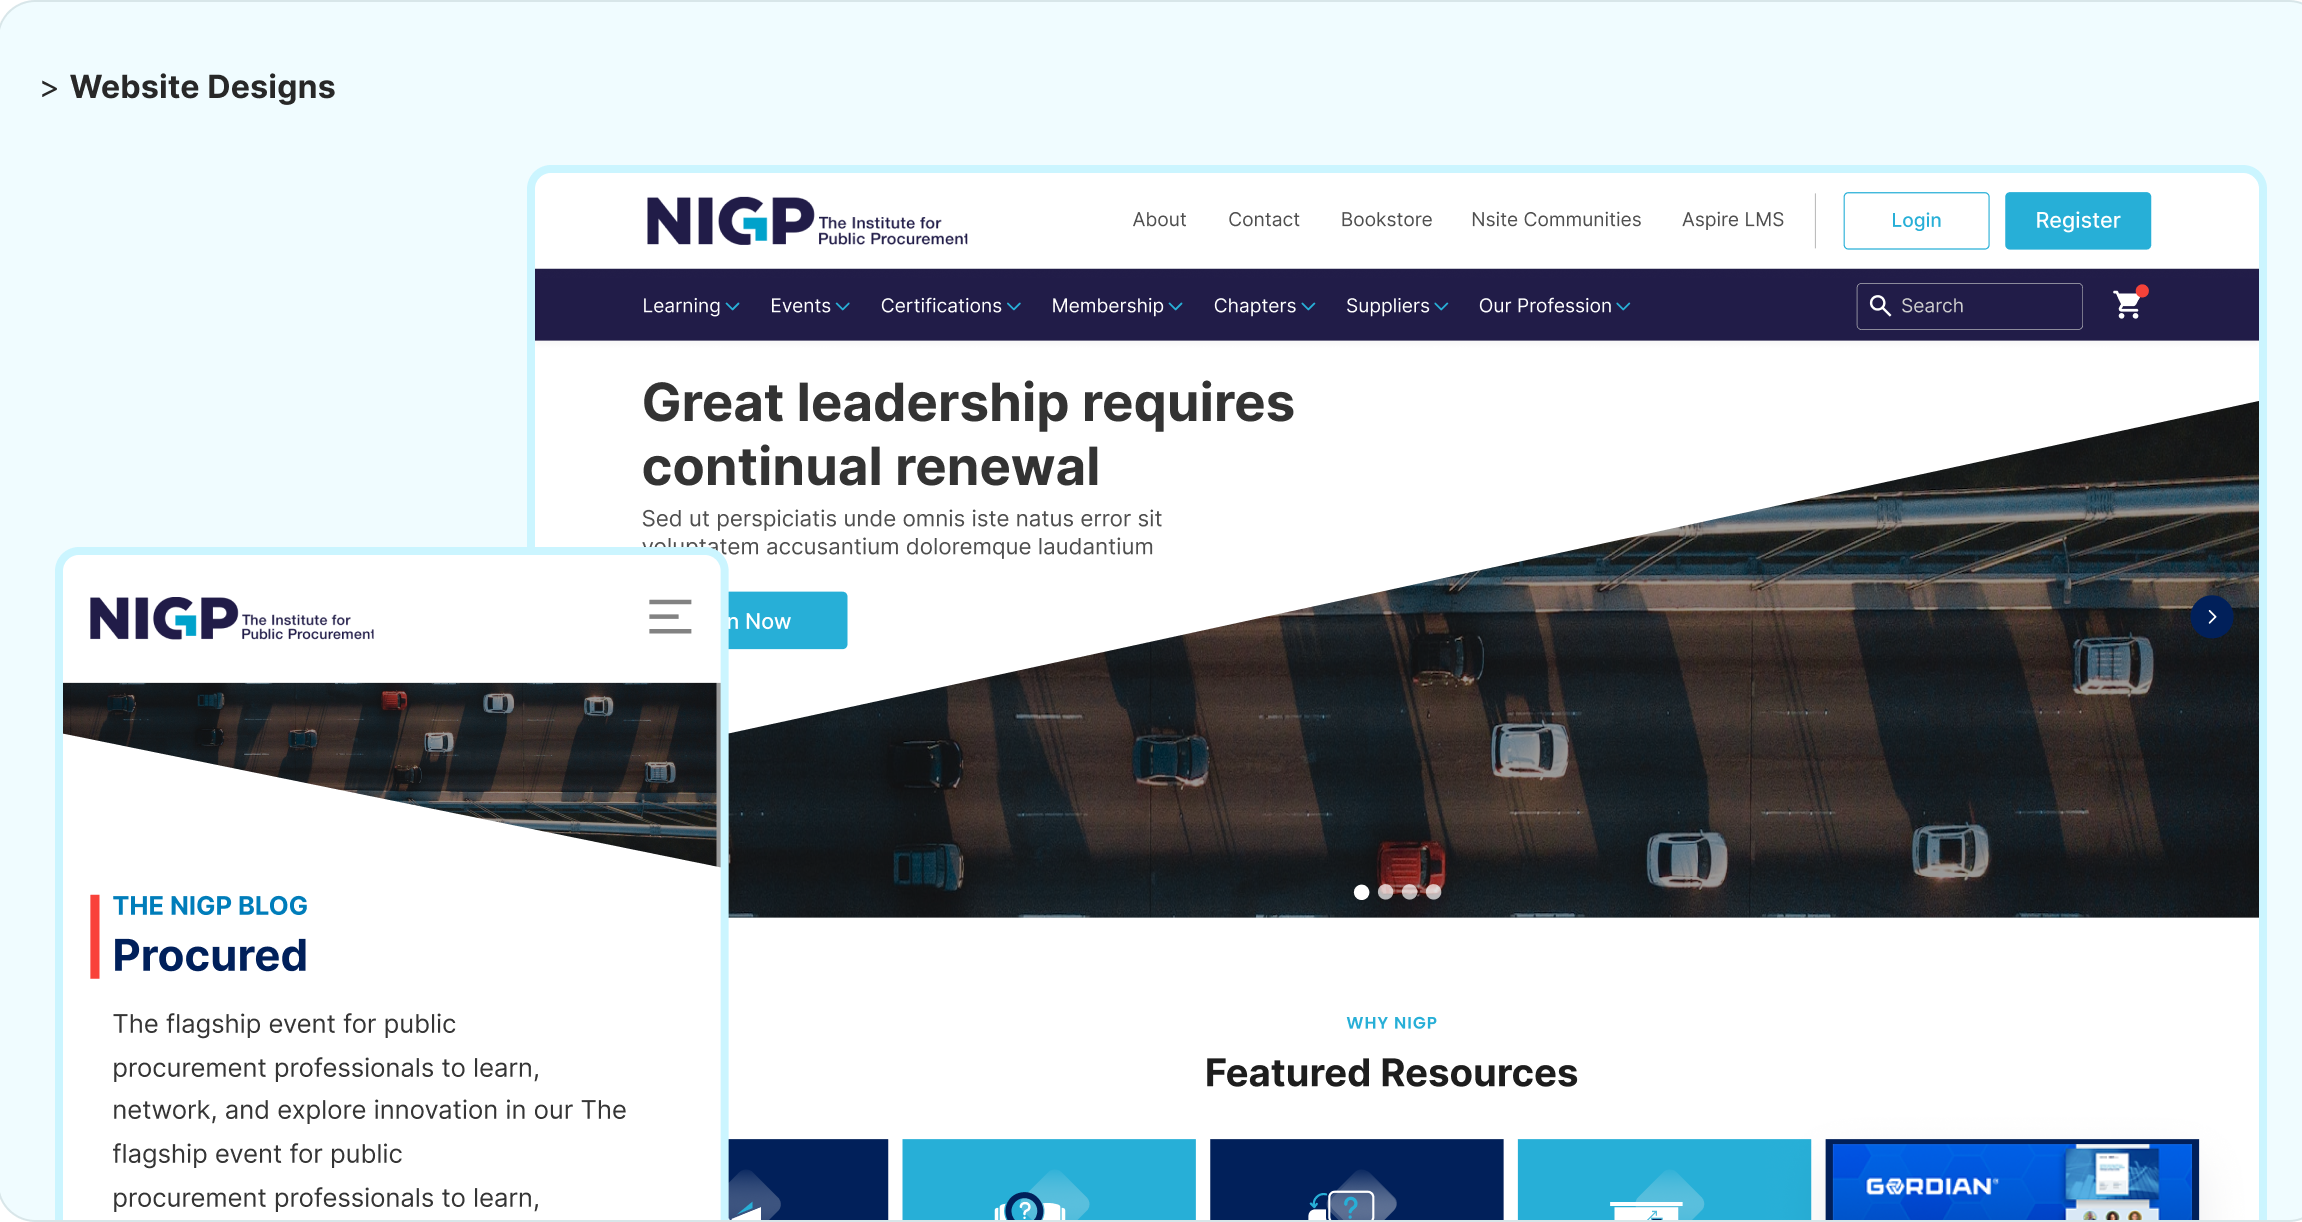
NIGP

Enabling leaders in procurement to access knowledge seamlessly..
> Designed the NIGP corporate website to enhance resource discovery and learning.
> Focused on UX consistency across the public and member-only sections.
> Created responsive content templates for reports, events, and leadership programs.
> Improved search structure with contextual filters and metadata tagging.